 Elastic Beanstalk Enhanced Health Reporting
When you start using AWS Elastic Beanstalk, you quickly learn that the Health dashboard is the best place to go to understand what is going on on your app. If you’re anything like me, however, you might be disappointed to find some of the most useful fields are blank, like this:
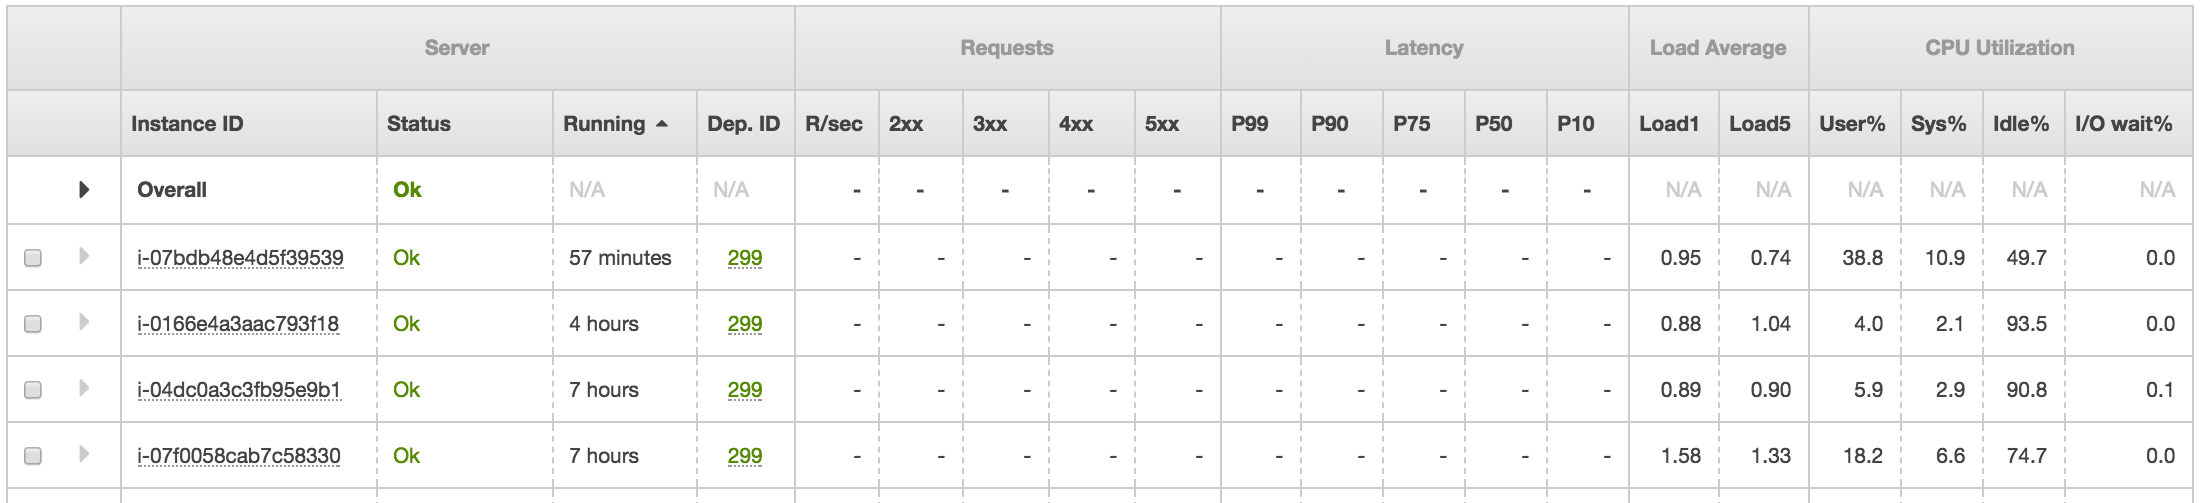
The issue is that Elastic Beanstalk fetches the data for these tables from the host machine, as opposed to the container in which your app is running. In order to get the data to the Health dashboard, we will have to change a number of things first.
Note: This document assumes you’re using nginx, but the steps should be similar if you’re using a different server.
Step 1: Sync a directory between the container and the host machine
To do this in Elastic Beanstalk, you must edit your Dockerrun.aws.json and add the following two sections:
      "name": "REPO",
+     "mountPoints": [
+       {
+         "sourceVolume": "healthd-logs",
+         "containerPath": "/var/log/nginx"
+       }
+     ]
    }
+ ],
+ "volumes": [
+   {
+     "name": "healthd-logs",
+     "host": {
+       "sourcePath": "/var/log/nginx"
+     }
+   }
  ]
}
You have to add both the mountPoints section and the volumes section in order to make both the container and the host machine aware of the directory. Once you have this change in place, creating a file in /var/log/nginx on the container should also create the same file on the host machine.
Step 2: Prep your host machine for the new logs
Your host machine won’t have the right directory structures initially, so we will have to create an ebextension to set up the system.
Create healthd.config file in your .ebextensions directory with the following content:
# this file contains the requirements for enhanced health metrics on the EB console
# the basic idea is we need to have nginx write to some logs and make them available
# on the EB _host machine_, which means we need to share them from the docker container.
# c.p. https://docs.aws.amazon.com/elasticbeanstalk/latest/dg/health-enhanced-serverlogs.html

# this directory will be shared with the docker container it is used to pass enhanced
# health metrics to the host machine, which in turn appear on the EB health dashboard
commands:
  01_create_nginx_log_dirs:
    command: "mkdir -p /var/log/nginx"
  02_create_healthd_log_dirs:
    command: "mkdir -p /var/log/nginx/healthd"
Now your instances should come up with the correct directory structure when they come up, so the next step is creating the log files for Elastic Beanstalk to parse.
Step 3: Update your nginx config to create the healthd log file
Next you will have to tell nginx to create the log file in the format that Elastic Beanstalk expects. Luckily they have written some pretty useful docs on how to do this, but I’ll skip right to the point here.
Add this to the nginx config inside your container:
# set up log format for Elastic Beanstalk enhanced health logs
# c.p. https://docs.aws.amazon.com/elasticbeanstalk/latest/dg/health-enhanced-serverlogs.html
log_format healthd  '$msec"$uri"'
                    '$status"$request_time"$upstream_response_time"'
                    '$http_x_forwarded_for';

if ($time_iso8601 ~ "^(\d{4})-(\d{2})-(\d{2})T(\d{2})") {
  set $year $1;
  set $month $2;
  set $day $3;
  set $hour $4;
}

# set up log files for Elastic Beanstalk enhanced health logs
access_log /var/log/nginx/access.log combined;
access_log /var/log/nginx/healthd/application.log.$year-$month-$day-$hour healthd;
Now when you visit your application, a new log file should be created that looks something like /var/log/nginx/healthd/application.log.2017-09-29-15.
Step 4: Confirm everything is working
Check the following:
- Are
application.logfiles being created in/var/log/nginx/healthdon the container? - Are those files available in the same path on the host machine?
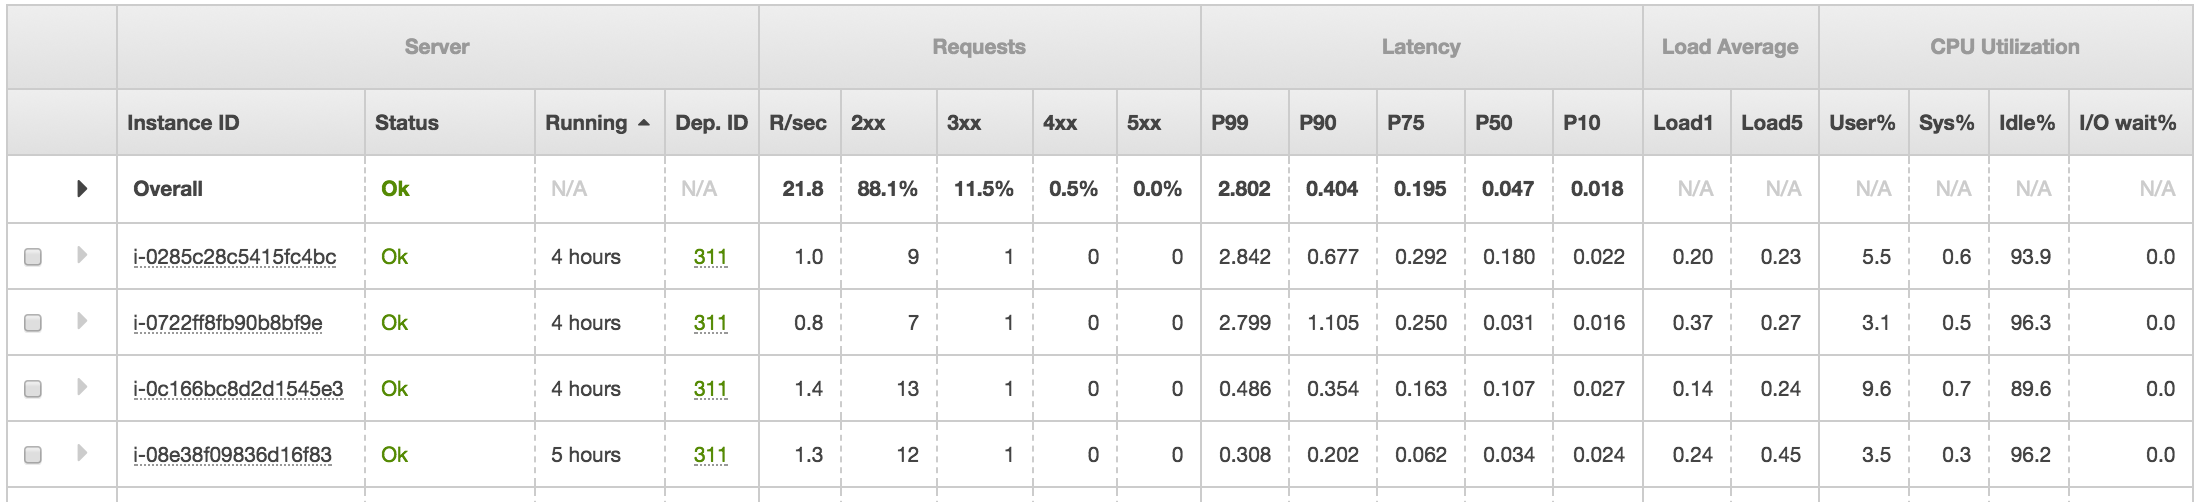
If the answer to both of these is yes, you should be done! Visit the Health dashboard on your Elastic Beanstalk web console and you should be able to see all of the Enhanced Health data, like this:
Thanks for reading. I hope this helps you, and please reach out to me with anything I could do to improve these instructions.
While you’re here, check out the coolest thing I’ve made: The Most Boring Stream on Twitch.